NOTE: The .xlsx file is available for download; however, the data was prepared and analyzed in JMP Student Edition 18.
NOTE: The “2016HMDACodeSheet” was provided to me; it was not created by me.
Introduction and Business Understanding: The Federal Financial Institutions Examination Council (FFIEC), Home Mortgage Disclosure Act (HDMA) “…data and reports are the most comprehensive publicly available information on mortgage market activity” (FFIEC, 2023). The FFIEC, HDMA maintains the Modified Loan/Application Register (LAR), which is data for “…every financial institution that has completed a HMDA data submission in the select year” (FFIEC, 2024). The purpose of this study was to perform comparative predictive modeling on 2016 HDMA LAR data for Louisiana to determine the best model to use to predict whether a mortgage loan application in Louisiana will be denied.
Data Understanding: The raw HDMA_data_Known dataset contained 166,800 records and 26 columns of data, with one column being the response variable (Denied) where 0 (75%) represents an approved mortgage loan application and 1 (25%) represents a denied one. The remaining 25 columns contained a mix of superfluous data and predictor variables. The columns title Year, State, and STATE_FIPS were deemed to be superfluous because the values in each column were identical across all records; thus, these columns were excluded from the analysis. After this was done, 20 predictor variables (predictor(s)) remained. After screening for outliers and missing values, a total of 2,891 records were excluded from the dataset, for a new total of 163,909 records. It was also found that the column titled rateSpread_num had approximately 93% missing values, which was deemed to be too much for reliable imputation; therefore, this column was excluded from the analysis, leaving 19 columns remaining as variables. Then, the data was partitioned into training (60%), validation (20%), and test (20%) sets. Finally, recoding was performed based on the provided HMDA LAR code sheet, and binning each of the remaining 19 predictors was performed by using the decision tree partitioning method using JMP.
Analysis and Quality of Models: After the data was prepared, bootstrap forest, boosted tree, neural network, boosted neural network, and ensemble models were created, and the validation data was comparatively analyzed based on the sensitivity, specificity, false positive rate, false negative rate, error rate, and AUC (Figure 1); the ROC curve (Figure 2); the lift curve (Figure 3); the misclassification rate (Figure 4); and the cumulative gains curve (Figure 5) of each model. The metrics and outputs of the five models are discussed in the following five subsections.
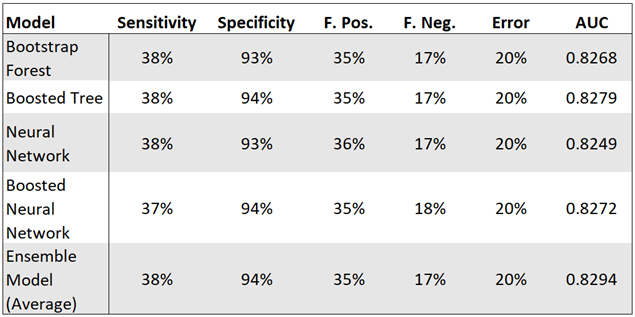
Combined Confusion Matrix: The combined confusion matrix results (Figure 1) showed that the boosted tree and the ensemble models performed nearly equally in that both models had the best metrics in terms of the highest sensitivity and specificity and the lowest false positive and false negative rates and error rate. The error rate for each model in Figure 1 is the respective misclassification rate Figure 4 but rounded to the nearest whole percent. The only difference in the metrics between the boosted tree and the ensemble model is the area under the curve (AUC) values, where the ensemble model was higher by 0.0015, or 0.15%.
Figure 1: Combined Confusion Matrix
Combined ROC Curves: The largest difference between the validation set AUCs of the receiver operating characteristics (ROC) curves was 0.0045, or 0.45% (Figure 2), indicating that each model performed nearly equally. The ensemble model performed the best at 0.8294, or 82.94%.
Figure 2: Combined ROC Curves

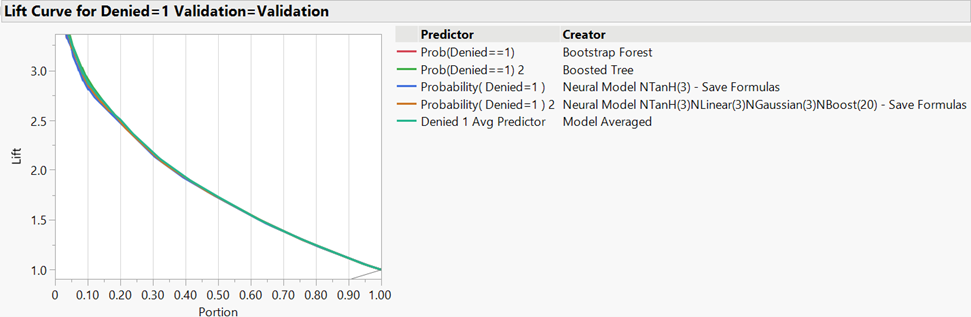
Combined Lift Curves: Prior to 50% of the data being considered, the boosted tree and ensemble models appeared to perform the best (Figure 3). At 50% of the data, each model appeared to perform equally. The overlaid data obfuscated much of the interpretability of the graph.
Figure 3: Combined Lift Curves
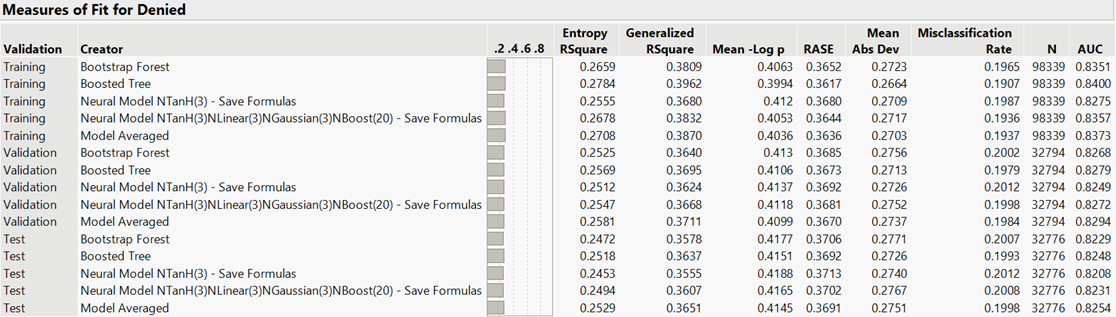
Combined Measures of Fit: The unrounded misclassification rates of the rounded error rates in Figure 1 are presented in Figure 4. Also, the misclassification rates and AUCs of the validation and test sets for each model are presented.
Figure 4: Combined Measures of Fit
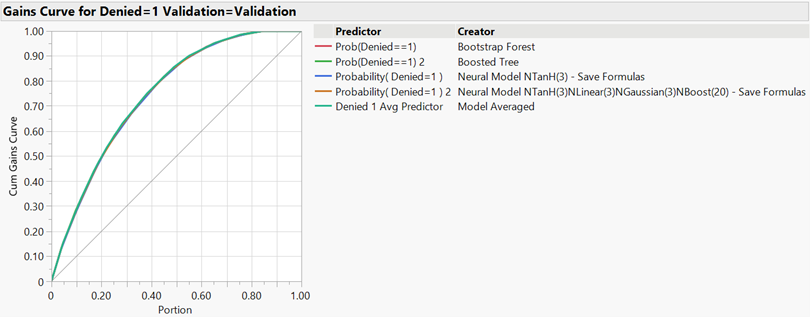
Combined Cumulative Gains Curves: The boosted tree and ensemble models appeared to perform the best (Figure 5). The overlaid data obfuscated much of the interpretability of the graph.
Figure 5: Combined Cumulative Gains Curves
Conclusion: The purpose of this study was to perform comparative predictive modeling on 2016 HDMA LAR data for Louisiana to determine the best model to use to predict whether a mortgage loan application in Louisiana will be denied.
The boosted tree and the ensemble model performed equally best with respect to the confusion matrix (Figure 1). The ensemble model had the higher AUC of 0.8294 compared to 0.8279, for a difference of 0.0015 (Figure 2); however, the difference between the validation AUC and test AUC for the boosted tree was 0.0031 compared to 0.004 of the ensemble model, which indicated that the boosted tree actually performed better than the ensemble model. The boosted tree had an unrounded misclassification rate of 19.79% compared to the 19.84% misclassification rate of the ensemble model, for a difference of 0.05% (Figure 4). The difference between the misclassification rates of the validation and test sets for these two models was 0.14% for each model, which indicated that the boosted tree performed better. The comparative performance of these two models with respect to the lift curve (Figure 3) and the cumulative gains curve (Figure 5) was uninterpretable due to the obfuscatory overlay of the data.
Furthermore, maintaining a boosted tree model is easier, more cost effective, and less time consuming than maintaining an ensemble model because every model in the ensemble must be updated as opposed to just the boosted tree.
Therefore, the boosted tree is the best predictive model to use to predict whether a mortgage loan application in Louisiana, based on 2016 HDMA LAR data for Louisiana, will be denied.
References:
FFIEC, Home Mortgage Disclosure Act. (2023). HMDA data publication. https://ffiec.cfpb.gov/data-publication/2023
FFIEC, Home Mortgage Disclosure Act. (2024). Modified loan/application register (LAR). (2024). https://ffiec.cfpb.gov/data-publication/modified-lar/2024
